
Statistical / Process Improvement
Introduction to Process Capability
A process capability has been defined as a sequence of interdependent procedures, operations, or steps that consume resources and convert the inputs into outputs. Each operation or step adds to the next to achieve a goal or desired result. In every process, there exists a certain amount of variation. Variation in a process cannot be eliminated, but it can be measured, monitored, reduced, and controlled. If we look at a simple example of making a cup of coffee, we can identify the inputs, steps, equipment, and output of the process.
Some of the inputs are coffee and water. The steps include turning on the coffee maker, measuring and adding the coffee and water and the output is a pot or cup of coffee. The variation can occur in the amount of coffee or water introduced in the process and the performance of the coffee maker itself. Not every cup of coffee is exactly the same but in most cases, if the measurements are controlled and reasonably consistent, it tastes the same. By utilizing process controls, taking measurements, and using reliable, well-maintained equipment, variation in a process can have less effect on the quality of the output. The process can be capable of producing acceptable products consistently. We can maintain Process Capability.
What is Process Capability
Process Capability (Cp) is a statistical measurement of a process’s ability to produce parts within specified limits consistently. To determine how our process is operating, we can calculate Cp (Process Capability), Cpk (Process Capability Index), or Pp (Preliminary Process Capability) and Ppk (Preliminary Process Capability Index), depending on the state of the process and the method of determining the standard deviation or sigma value. The Cp and Cpk calculations use sample deviation or deviation mean within rational subgroups. The Pp and Ppk calculations use standard deviation based on studied data (whole population). The Cp and Cpk indices are used to evaluate existing, established processes in statistical control. The Pp and Ppk indices are used to evaluate a new process or one that is not in statistical control.
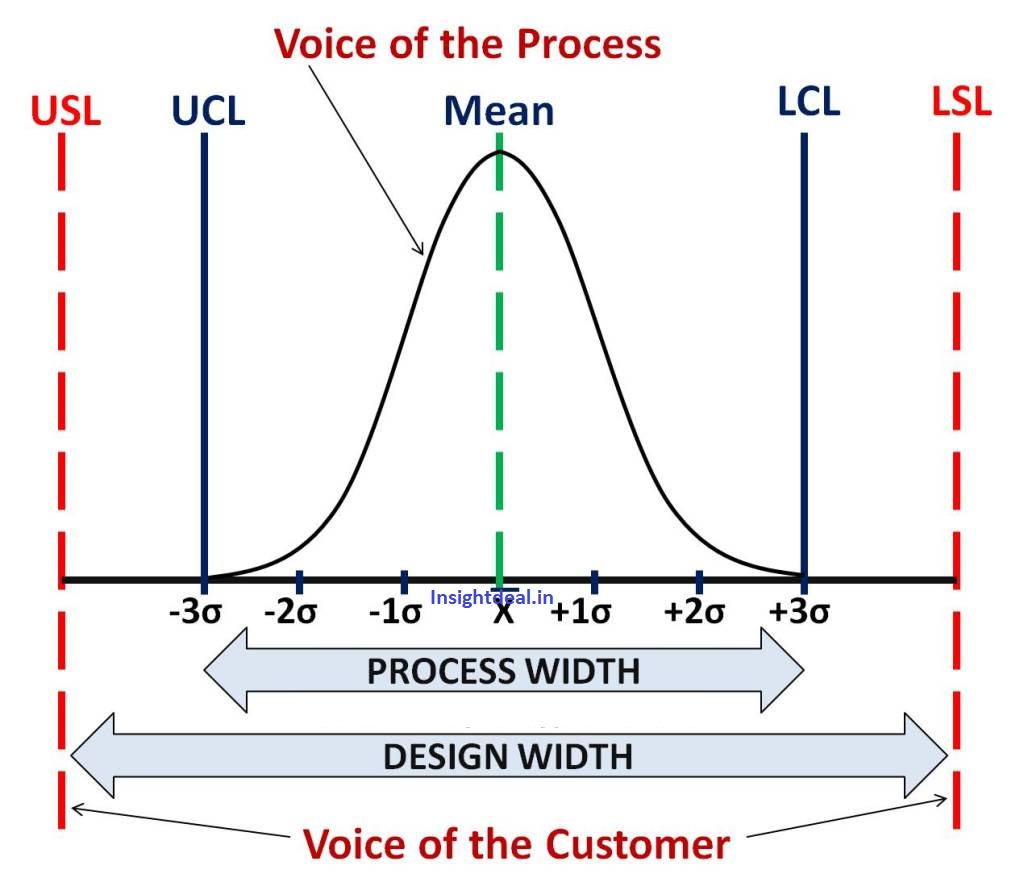
Process capability indices Cp and Cpk evaluate the output of a process in comparison to the specification limits determined by the target value and the tolerance range. Cp tells you if your process is capable of making parts within specifications and Cpk tells you if your process is centered between the specification limits. When engineers are designing parts, they must consider the capability of the machine or process selected to produce the part.
To illustrate, let us use a real-world example. Imagine that you are driving your vehicle over a bridge. The width of your vehicle is equivalent to the spread or range of the data. The guardrails on each side of the bridge are your specification limits. You must keep your vehicle on the bridge to reach the other side. The Cp value is equivalent to the distance your vehicle stays away from the guardrails and Cpk represents how well you are driving down the middle of the bridge. Obviously, if the spread of your data is narrower (your car width is smaller), the more distance there is between the vehicle and the guardrails and the more likely you are to stay on the bridge.
The Cp index is a fundamental indication of process capability. The Cp value is calculated using the specification limits and the standard deviation of the process. Most companies require that the process Cp = 1.33 or greater.
The Cpk index of the processing center goes a step further by examining how close a process is performing to the specification limits considering the common process variation. The larger the Cpk value the closer the mean of the data is to the target value. Cpk is calculated using the specification limits, standard deviation or sigma, and the mean value. The Cpk value should be between 1 and 3. If the value is lower than 1 the process needs improvement.
The Cp and Cpk indices are only as good as the data used. Accurate process capability studies are dependent upon three basic assumptions regarding the data:
- There are no special causes of variation in the process and it is in a state of statistical control. Any special causes must be discovered and resolved.
- The data fit a Normal distribution, exhibiting a bell-shaped curve, and can be calculated to plus or minus three sigmas. There are cases when the data does not fit a normal distribution.
- The sample data is representative of the population. The data should be randomly collected from a large production run. Many companies require at least 25 to preferably 50 sample measurements to be collected.
Why Measure Process Capability
In manufacturing and many other types of businesses, reduction of waste and providing a quality product are imperative if they are to survive and thrive in today’s marketplace. Waste exists in many forms in a process. When we look at the bigger picture, process capability is more than just measuring Cp and Cpk values. Process capability is just one tool in the Statistical Process Control (SPC) toolbox. Implementing SPC involves collecting and analyzing data to understand the statistical performance of the process and identifying the causes of variation within. Important knowledge is obtained by focusing on the capability of the process. Monitoring process capability allows the manufacturing process performance to be evaluated and adjusted as needed to assure products meet the design or customer’s requirements. When used effectively this information can reduce scrap, improve product quality and consistency and lower the cost to manufacture and the cost of poor quality.
How to Measure Process Capability
The capability indices can be calculated manually, although there are several software packages available that can complete the calculations and provide graphical data illustrating process capability. For the example in this section, we will utilize a popular statistical software package. For our example, we will utilize data from randomly collected measurements of a key characteristic of a machined part. To better represent the population values, the sample data must be randomly collected, preferably over time from a large production run. A few things to keep in mind:
- Our data is quantitative and variable
- Our data consists of 100 measurements
- The target dimension is 25.4 mm
- USL (Upper Specification Limit) = 25.527 mm
- LSL (Lower Specification Limit) = 25.273 mm
- Range = 0.254 mm
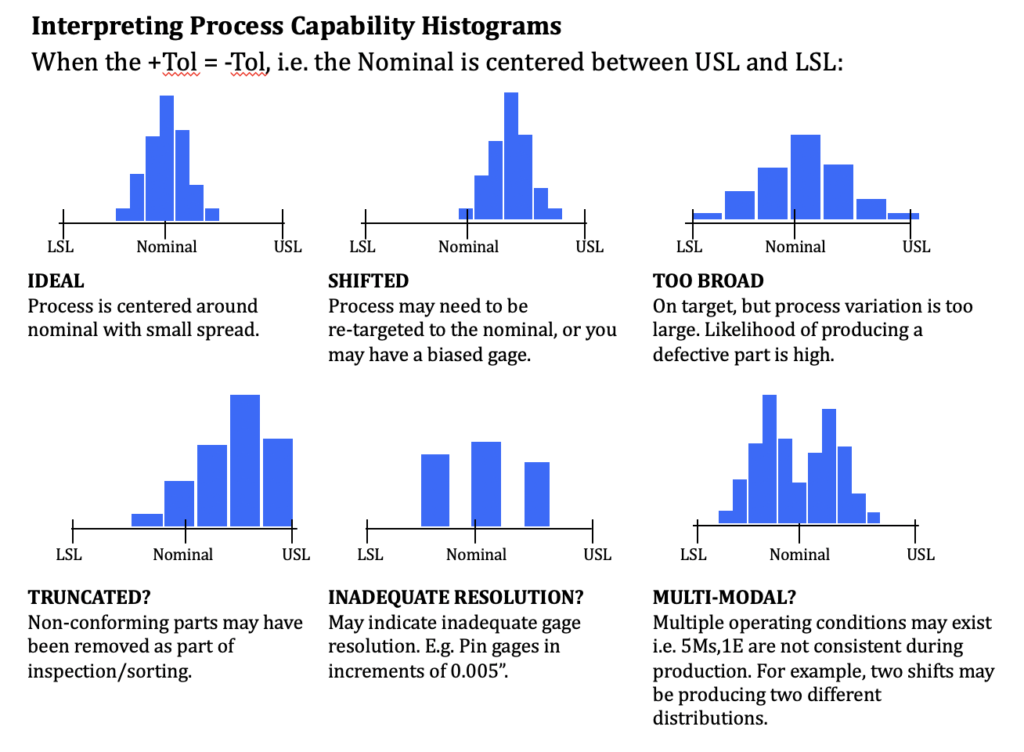
First, we will examine our data with a simple histogram to determine if it could fit a normal distribution. In addition, we can generate a probability plot evaluating our data’s best fit to a line further indicating we are 95% confident that our data fit a normal distribution.
Now let us examine the Process capability report:
- Cp (Process Capability = 1.68
- Cpk (Process Capability Index) = 1.66
Using the graph, we can further evaluate process capability by comparing the spread or range of the product specifications to the spread of the process data, as measured by Six Sigma (process standard deviation units).
Through an examination of the reports, we can determine that our example process is in a state of statistical control. All the data points fall well within the specification limits with a normal distribution. A process where almost all the measurements fall inside the specification limits is deemed a capable process. Process capability studies are valuable tools when used properly. As previously mentioned the information gained is generally used to reduce waste and improve product quality. Also, by knowing your process capabilities, the design team can work with manufacturing to improve product quality, and processes that are “not in control” may be targeted for improvement. During a typical Kaizen event or other quality improvement initiatives, Process Capability is calculated at the start and end of the study to measure the level of improvement achieved. Accurate knowledge of process capability enables management to make decisions regarding where to apply available resources based on data.